

During the summer of 2019-2020 (from November to March), the whole world followed the development of the huge wildfires in New South Wales (NSW), Australia. In all newspapers, we saw images of towns under thick smoke, thousands of trees burnt, and koalas being saved from the flames. But to what extent were these wildfires unusual? Every summer, thousands of hectares are burnt in the New South Wales… but not to this extent. For example, according to MODIS satellite data (1), the 19/20 season has seen a burnt area that was 2.35 times bigger than the second most dramatic season 2002-2003 (see figure 2).
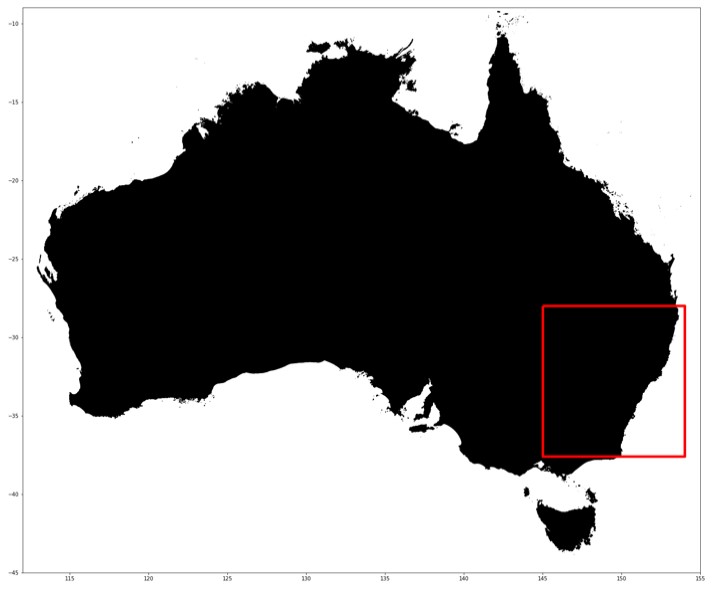
Figure 1: Coast of NSW showing the affected region
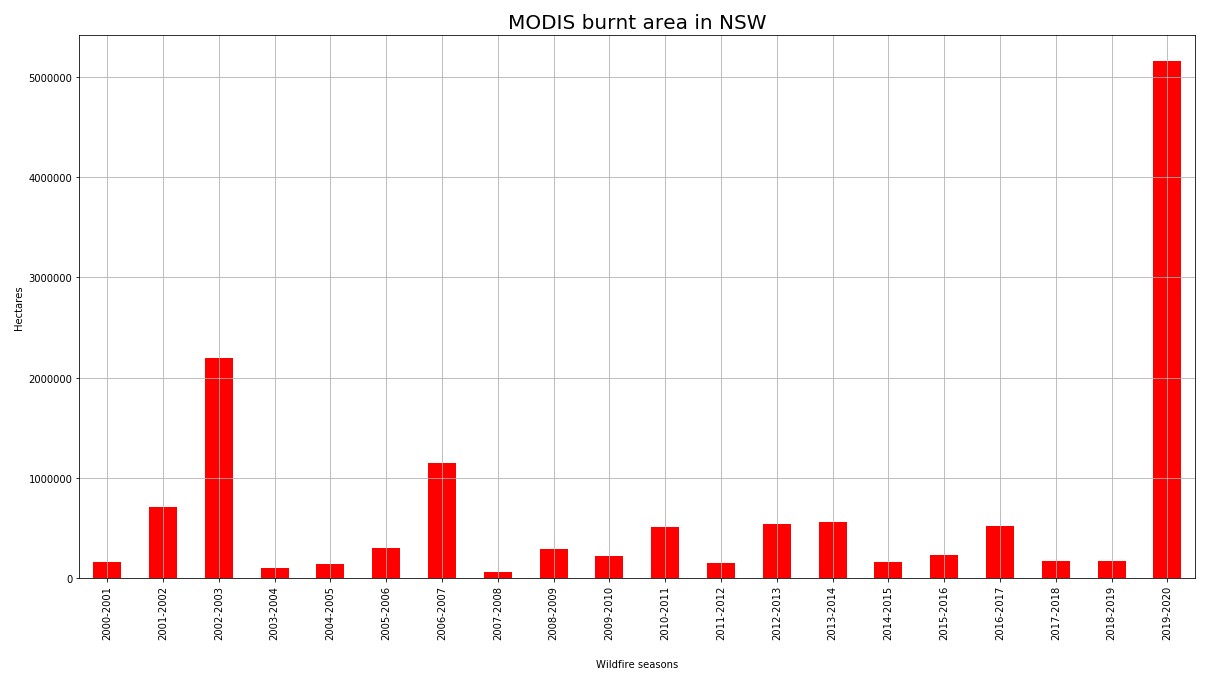
Figure 2: The burned area detected by MODIS foreach summer in NSW since 2000
The location of those wildfires was also unusual. In the previous seasons, wildfires occurred mostly inland where there is a lower density of population. In 2019-2020, they occurred on the coastal regions where mostly towns are located.
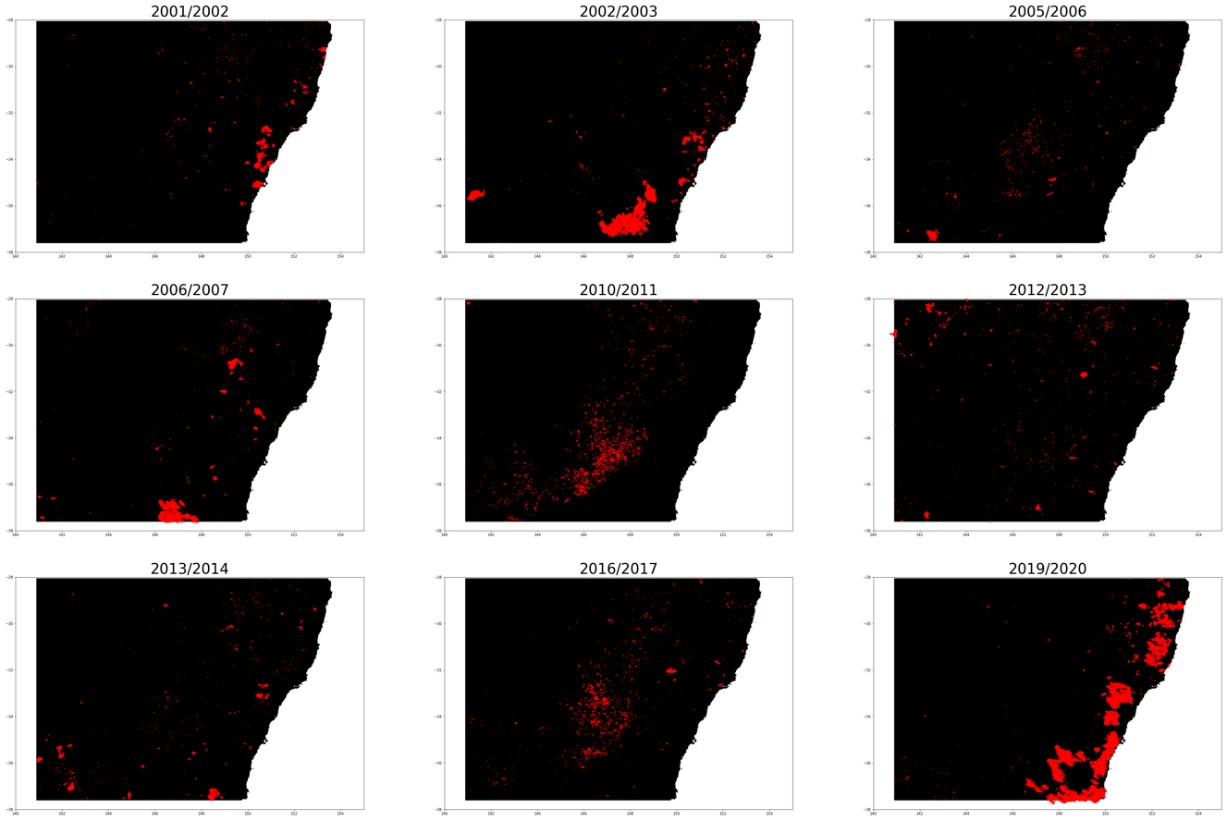
Figure 3: Locations of MODIS burnedareas for the 9 most important wildfire seasons in NSW
These two elements (very large spread and unusual locations) have led the NSW wildfires in 2019-2020 to be deemed as extremely uncommon. The question is why?
What are the direct causes of those events?
There are four conditions that need to be met in order for a wildfire to occur, two of which depend specifically on climatic conditions that can explain why this summer was so peculiar:
1. Fuel: The presence of a continuous and dense vegetation,which is the case in the coastal region of NSW where a lot of forests grow. Figure 4 shows the types of vegetation on the coast of NSW which clearly indicates the availibility of plenty of fuel for these fires.
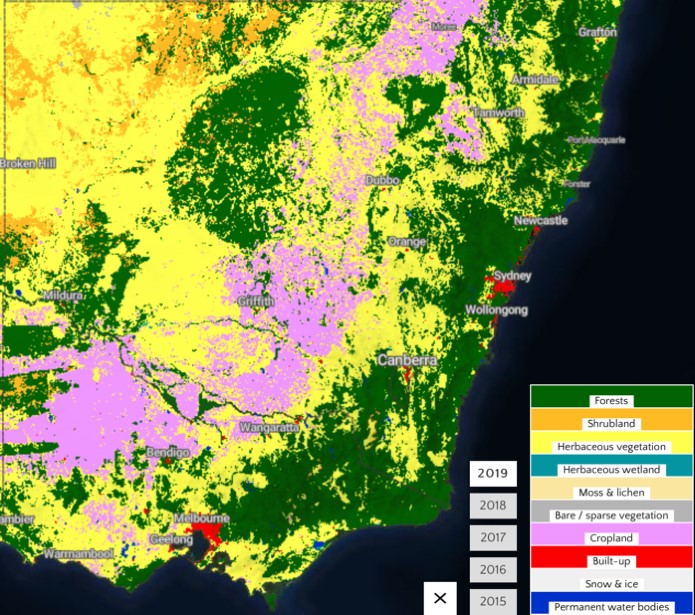
Figure 4: Copernicus globalland cover illustrates the forest cover on the coast of NSW (a)
2. Ignition sources: Wildfires are strange events because you can have all the physical conditions to start one but not end up having any. Why? They need an ignition point that is mostly due to human activities (electric power lines, cigarettes, agricultural cleaning, camping, etc.) As most of the cities and facilities on NSW are located on the coast, this increases the probability of starting a wildfire there.
3. Drought conditions: 2019 was a particularly dry year in the NSW, especially on the coast. To describe it, let’s look at the Standardized Precipitation Evapotranspiration Index (SPEI) (2) over a window of 6 months: The SPEI uses a climatic water balance model varying between -3 (very dry) and 3 (very wet). If we look at this SPEI over a window of 6 months, we can see that for November 2019 the SPEI for the NSW Coast was -1.8, whereas the mean value is usually 0. This is the lowest SPEI for this region since the data has been recorded.
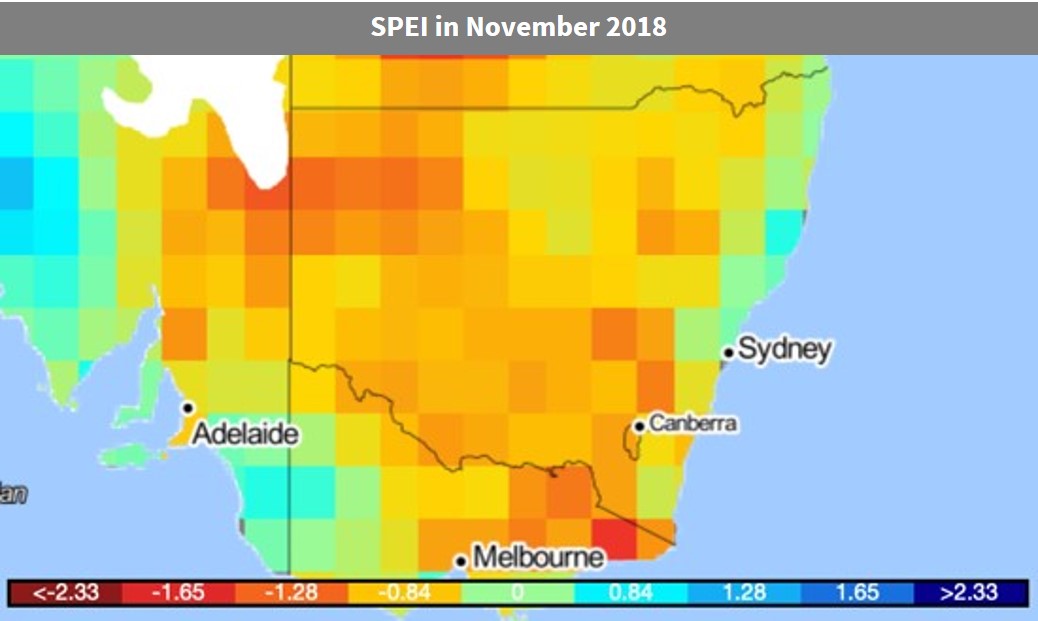
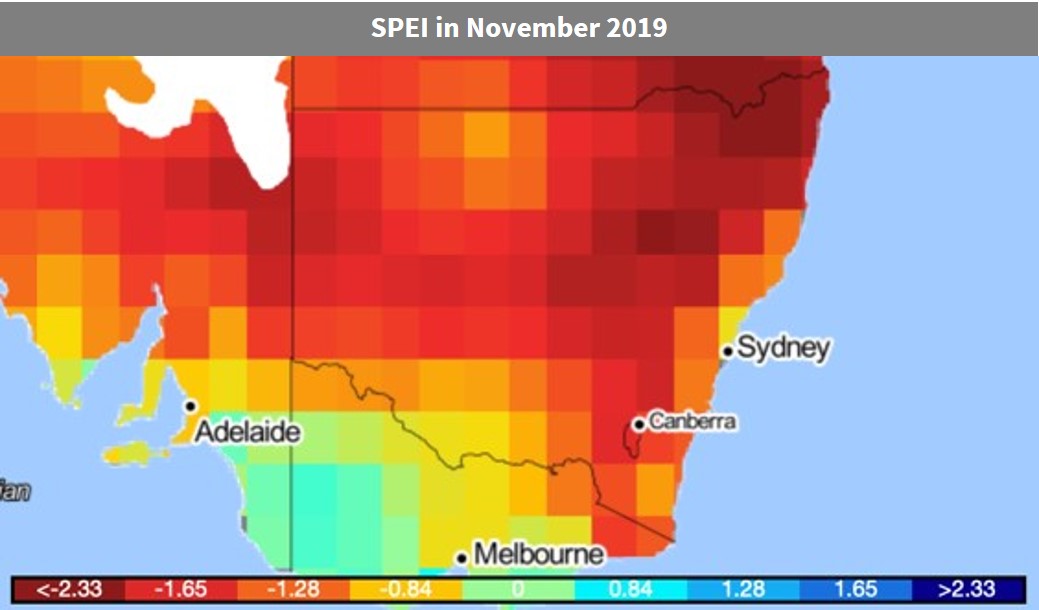
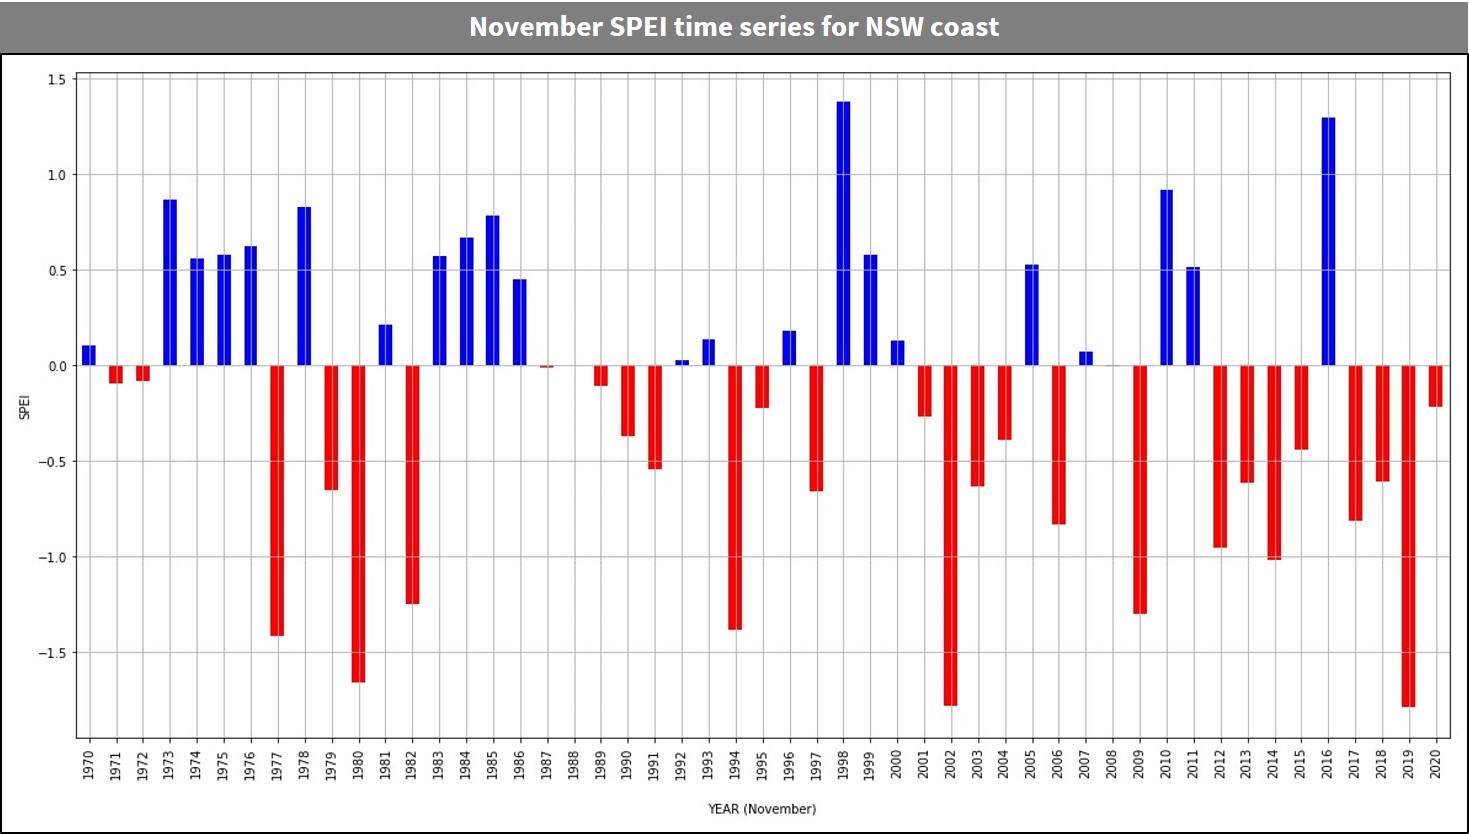
Figure 5: November SPEI over 6months for NSW coast (2)
As we have seen before, the summer 2002-2003 was also a hard one in terms of wildfires. We can see on Figure 5 that 2002 was a very dry year, similar to 2019. The main difference between the two seasons lies on the duration of the drought: it lasted the whole year in 2019 but only five months in 2002.
4. Weather conditions particularly influence the spreading of wildfires. There are several synthetic indexes mixing meteorological elements (wind, precipitation, temperature and humidity of the air), the most renowned one being the Fire Weather Index (FWI) (3) created by Météo France and the Meteorological Service of Canada.
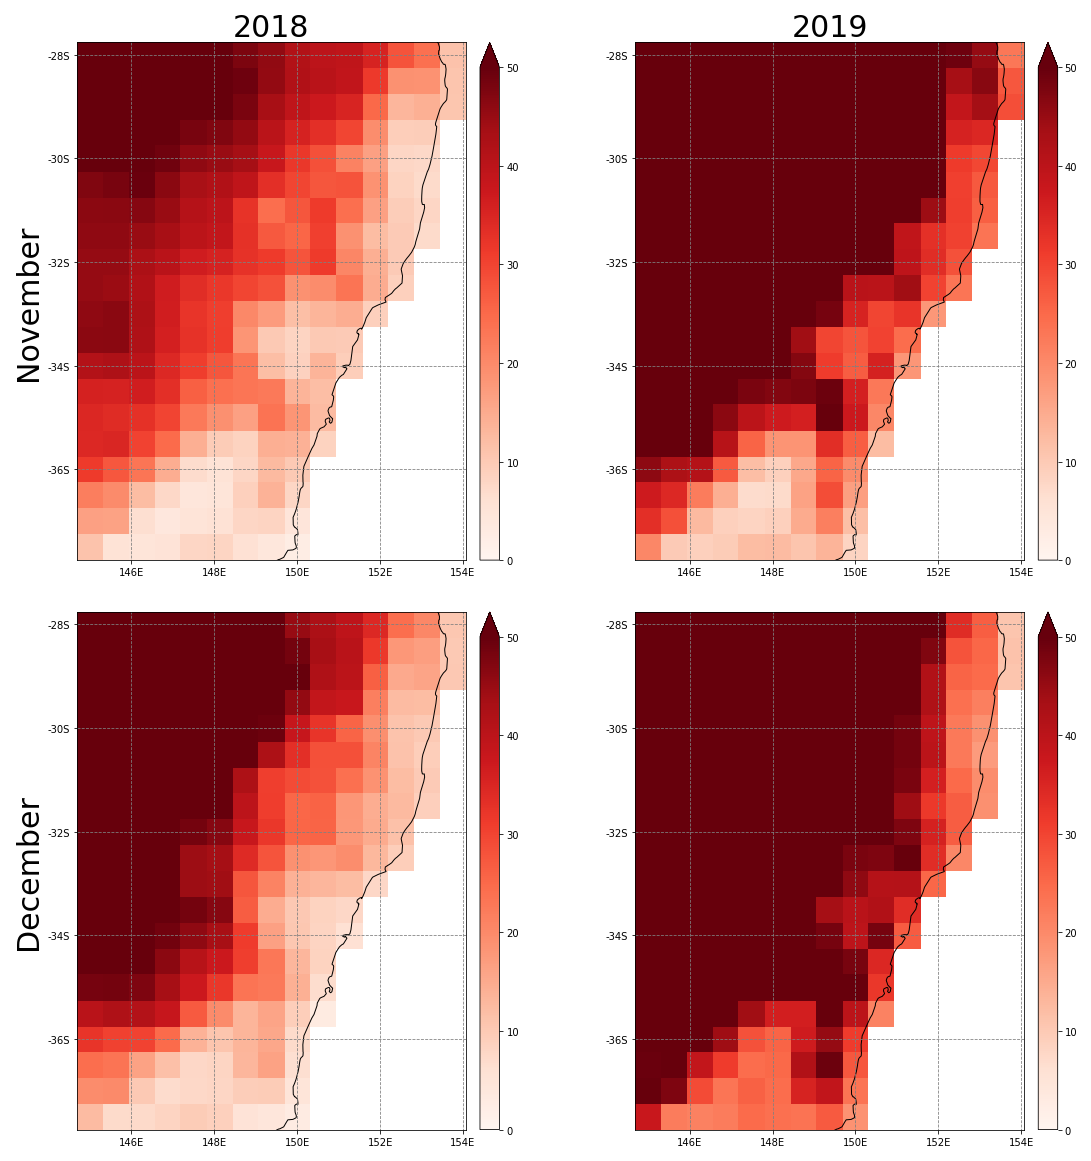
Figure 6: Comparison of FWI (MERRA2) levels between 2018 and 2019 (5)
The higher the FWI, the more favorable are the conditions for the wildfires. Usually we consider the risk as severe when it is above 30 (4).
In November and December 2019, NSW had severe levels of FWI compared to the same period in 2018. But it was mostly the coast that suffered unexpected weather conditions that were very favorable for the wildfire propagation: the mean FWI on the coast was at the highest level since the data has been recorded (1980).
All conditions were set to unleash an extreme event: significant forest area, a long drought period and wildfire-favorable weather. In these conditions any ignition point could start a huge event…which is exactly what happened.
But we need now to ask another question: Is this combination of factors a true anomaly or are we going to see more dramatic episodes, like this, under the effects of climate change?
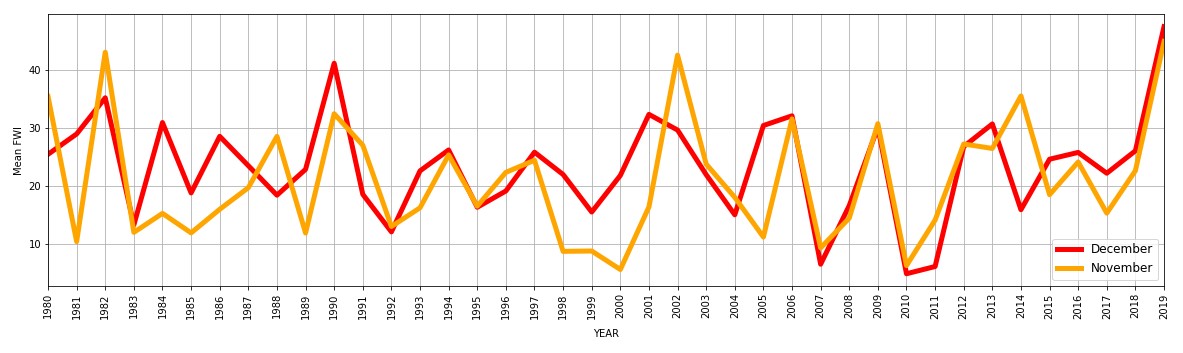
Figure 7: Evolution of FWI (MERRA2) in November and December for the coast of NSW
Are these events related to climate change?
Among the four factors leading to wildfires, weather and drought conditions are directly impacted by climate change. To understand if the 2019-2020 season was an anomaly or the consequence of this change, we will look at the historical dynamic of drought and weather conditions.
Let’s start with drought. The SPEI calculations since 1960 show us the evolution of the drought season on the NSW coast. To know if a period of 10 years is exceptional, we can count the number of years where the drought season lasts for more than 2 months (SPEI is below the 10th percentile) (6). It indicates the severity and the length of the drought season.
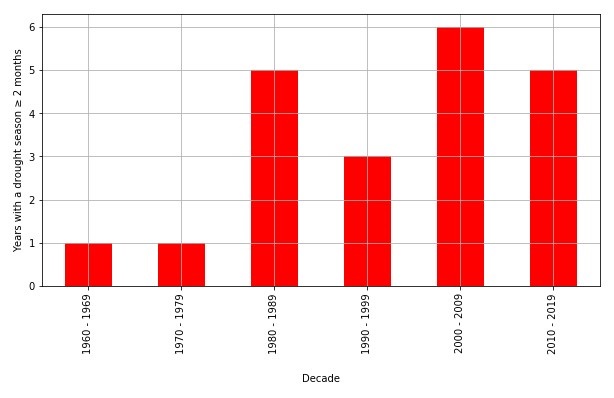
Figure 8: Number of years where the drought season last more than 2 months (SPEI is below the 10th percentile) on the NSW coast
Figure 8 shows us an important result. From 1960 to 1999 (40 years), we have 10 years where the SPEI is lower than the 10th percentile for more than 2 months. So 10 years out of the 40 years or 20% of the time, there were longer-than-usual droughts. Whereas since 2001 (20 years) we can count almost the same number of years: 11 years, which means 55% of the years since 2001 have had long droughts. This statistic shows that long and severe droughts are more and more frequent. The peak was in 2019 when drought conditions continued throughout the entire year.
Now, let’s have a look at the evolution of the FWI. We compute the same analysis as for the SPEI: Look at the number of months per year where the FWI is above the 90th and 95th percentiles for the control period 1980-1999. The conclusions are not as sharp as the ones of drought.
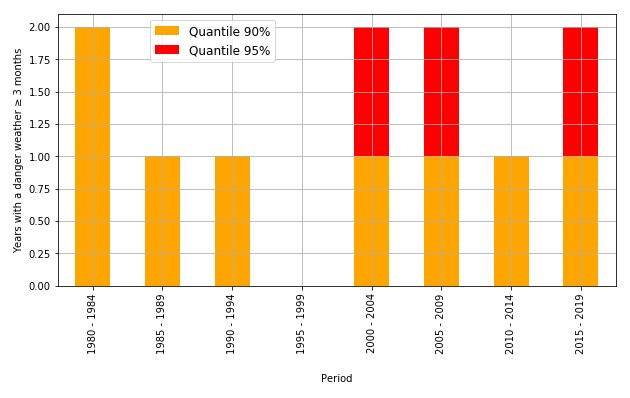
Figure 9: Number of years where the favorable weather conditions last more than 3 months (FWI is over the 90th and 95th percentile) on the NSW coast
If we look at the number of months over the 90th percentile, we cannot conclude that there is an intensification of weather conditions favorable to wildfire. However, when we consider the extreme levels of FWI (95th percentile), we notice that after 2000, NSW faced longer and more intense episodes of fire than before. However, it may be too soon to link that directly with climate change.
Conclusion
The wildfire season of 2019-2020 in NSW was extraordinary in all aspects: intensity, extension, location, combination offactors, etc. which is why it made headlines across the world. These wildfires will have a long-term impact on the biodiversity and landscape in Australia. Though we cannot conclude that they were due to climate change, we do see some trends that were favorable to their occurrence. If the dynamic continues as in the past or if things get worst (according to the scenarios of the Intergovernmental Panel on Climate Change) we should face more and more extreme wildfire seasons in this part of the world.